The case of the curiously slow shader
These days, a significant amount of my time and energy is getting piet-gpu, a compute-focused 2D rendering engine, to run well on mobile hardware. Not too long ago, I got it running on Pixel 4, and breathlessly waited for the performance numbers, which turned out to be… disappointing. I was able to figure out why, but therein lies a story.
To track this down, I had to dive pretty deep into the lower levels of GPU infrastructure, and learned a lot in the process. And I’ll end with a look into the Vulkan memory model and why it could help with these performance portability concerns going forward.
Initial results
To recap, piet-gpu is an experimental rendering engine designed for vector graphics content (especially font rendering). It’s based on a pipeline of compute shaders, not the more familiar triangle rasterization pipeline with its vertex and fragment shaders. Compute shaders have more flexibility to process data structures representing 2D vector content, and compute high quality antialiasing without relying on hardware MSAA. Even so, the approach is speculative, and it is not obvious that it will work well on mobile GPU.
The early results on desktop GPU where encouraging. On high-end discrete cards, performance is amazing, but that’s not surprising considering how much raw horsepower they have. Integrated graphics is perhaps a more useful baseline for comparison.
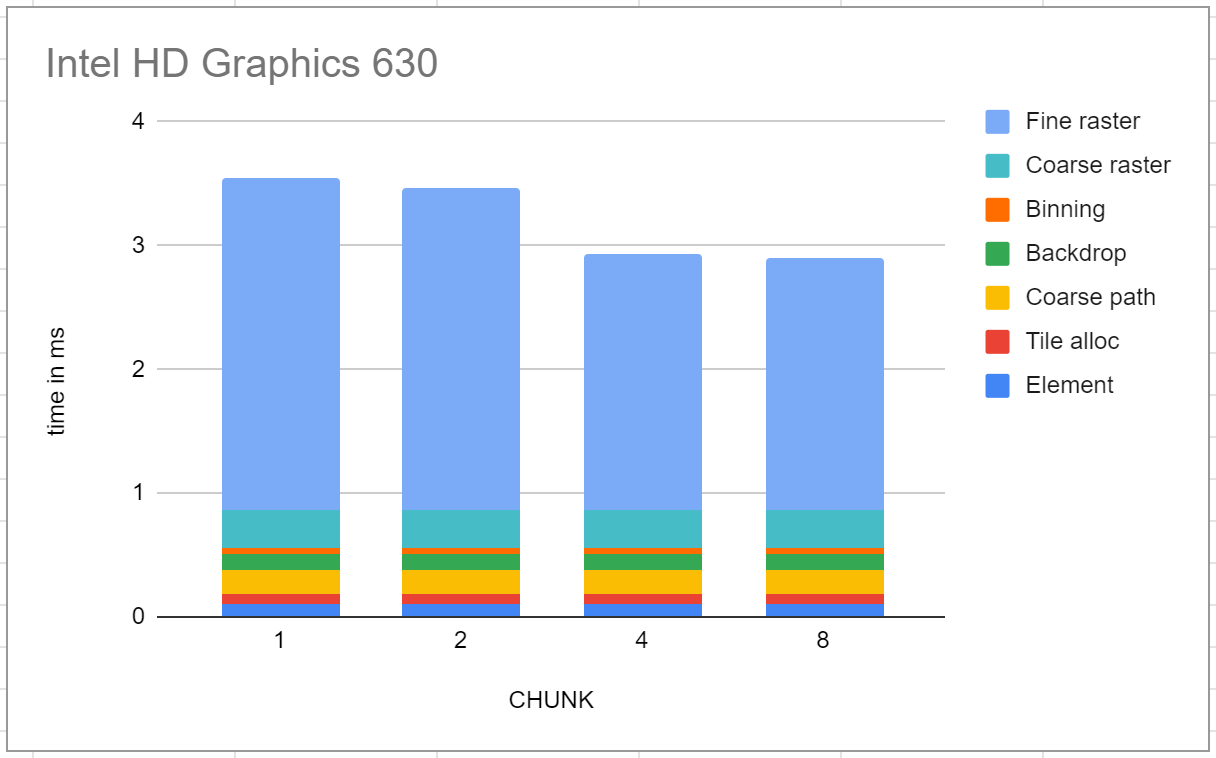
The test is rendering a Ghostscript tiger at a resolution of 1088x2288 pixels. There are 7 pipeline stages, most of which are very quick to run, so the bulk is in the final stage, fine rasterization. On Intel HD Graphics 630, the first six pipelines take a total of 0.86 ms, and the fine rasterization 2.04ms at the best setting of CHUNK (about which more later; in any case performance is not very sensitive to this tuning parameter).
Running the same workload on a Pixel 4 gave much worse results. The first six stages take a total of 2.45ms, but the fine rasterization stage is 11.7ms, which is much slower than the Intel reference. Further, it’s very dependent on this CHUNK parameter, which if nothing else is evidence that the performance characteristics are very different.
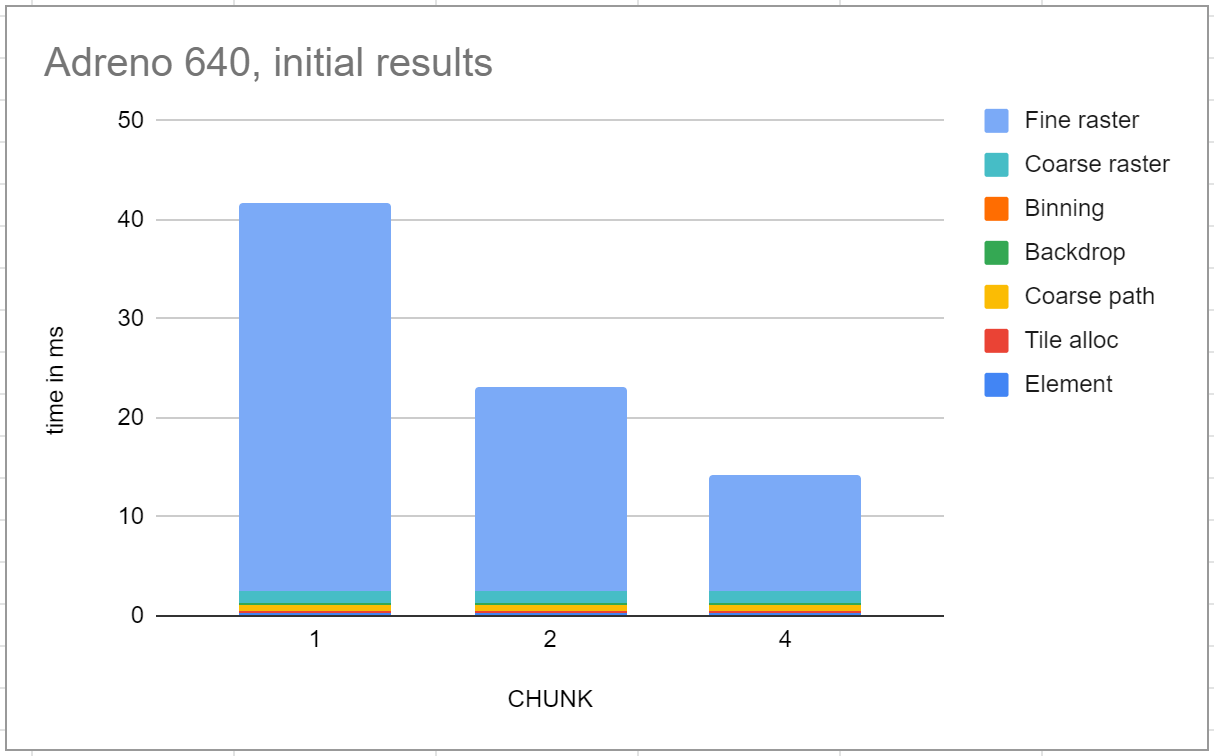
These numbers are disappointing. It’s barely capable of 60fps on the tiger, but that’s a simpler workload, and the display on this hardware actually has a refresh rate of 90fps.
But already there are some clues. Most of the pipeline stages are reasonably fast, but the fine rasterization stage is disproportionately slow. That’s evidence that the GPU has raw horsepower roughly half of the Intel chip, but there’s something going wrong in this one shader.
Reading performance counters
GPU performance is something of a black box, but there are tools that can help. Most GPU hardware has performance counters, which measure total read/write memory bandwidth, ALU utilization, and other similar metrics. Traditionally, there are proprietary vendor-specific tools to read these, but in the Android world attention is moving to Android GPU Inspector, an open source tool now in beta.
These performance counters are especially useful for ruling out some hypotheses. One early hypothesis I had is that the Adreno 640 is seriously register-limited compared to desktop GPUs. That would result either in spilling (data ordinarily stored in registers would be written to memory instead) or low occupancy (fewer workgroups would be scheduled in each Streaming Processor, resulting in more stalls). If register spilling was the problem, then the performance counters would show significantly larger read/write traffic to memory.
At first, I couldn’t get AGI to work, but upgrading to the 1.1 dev version fixed that problem.
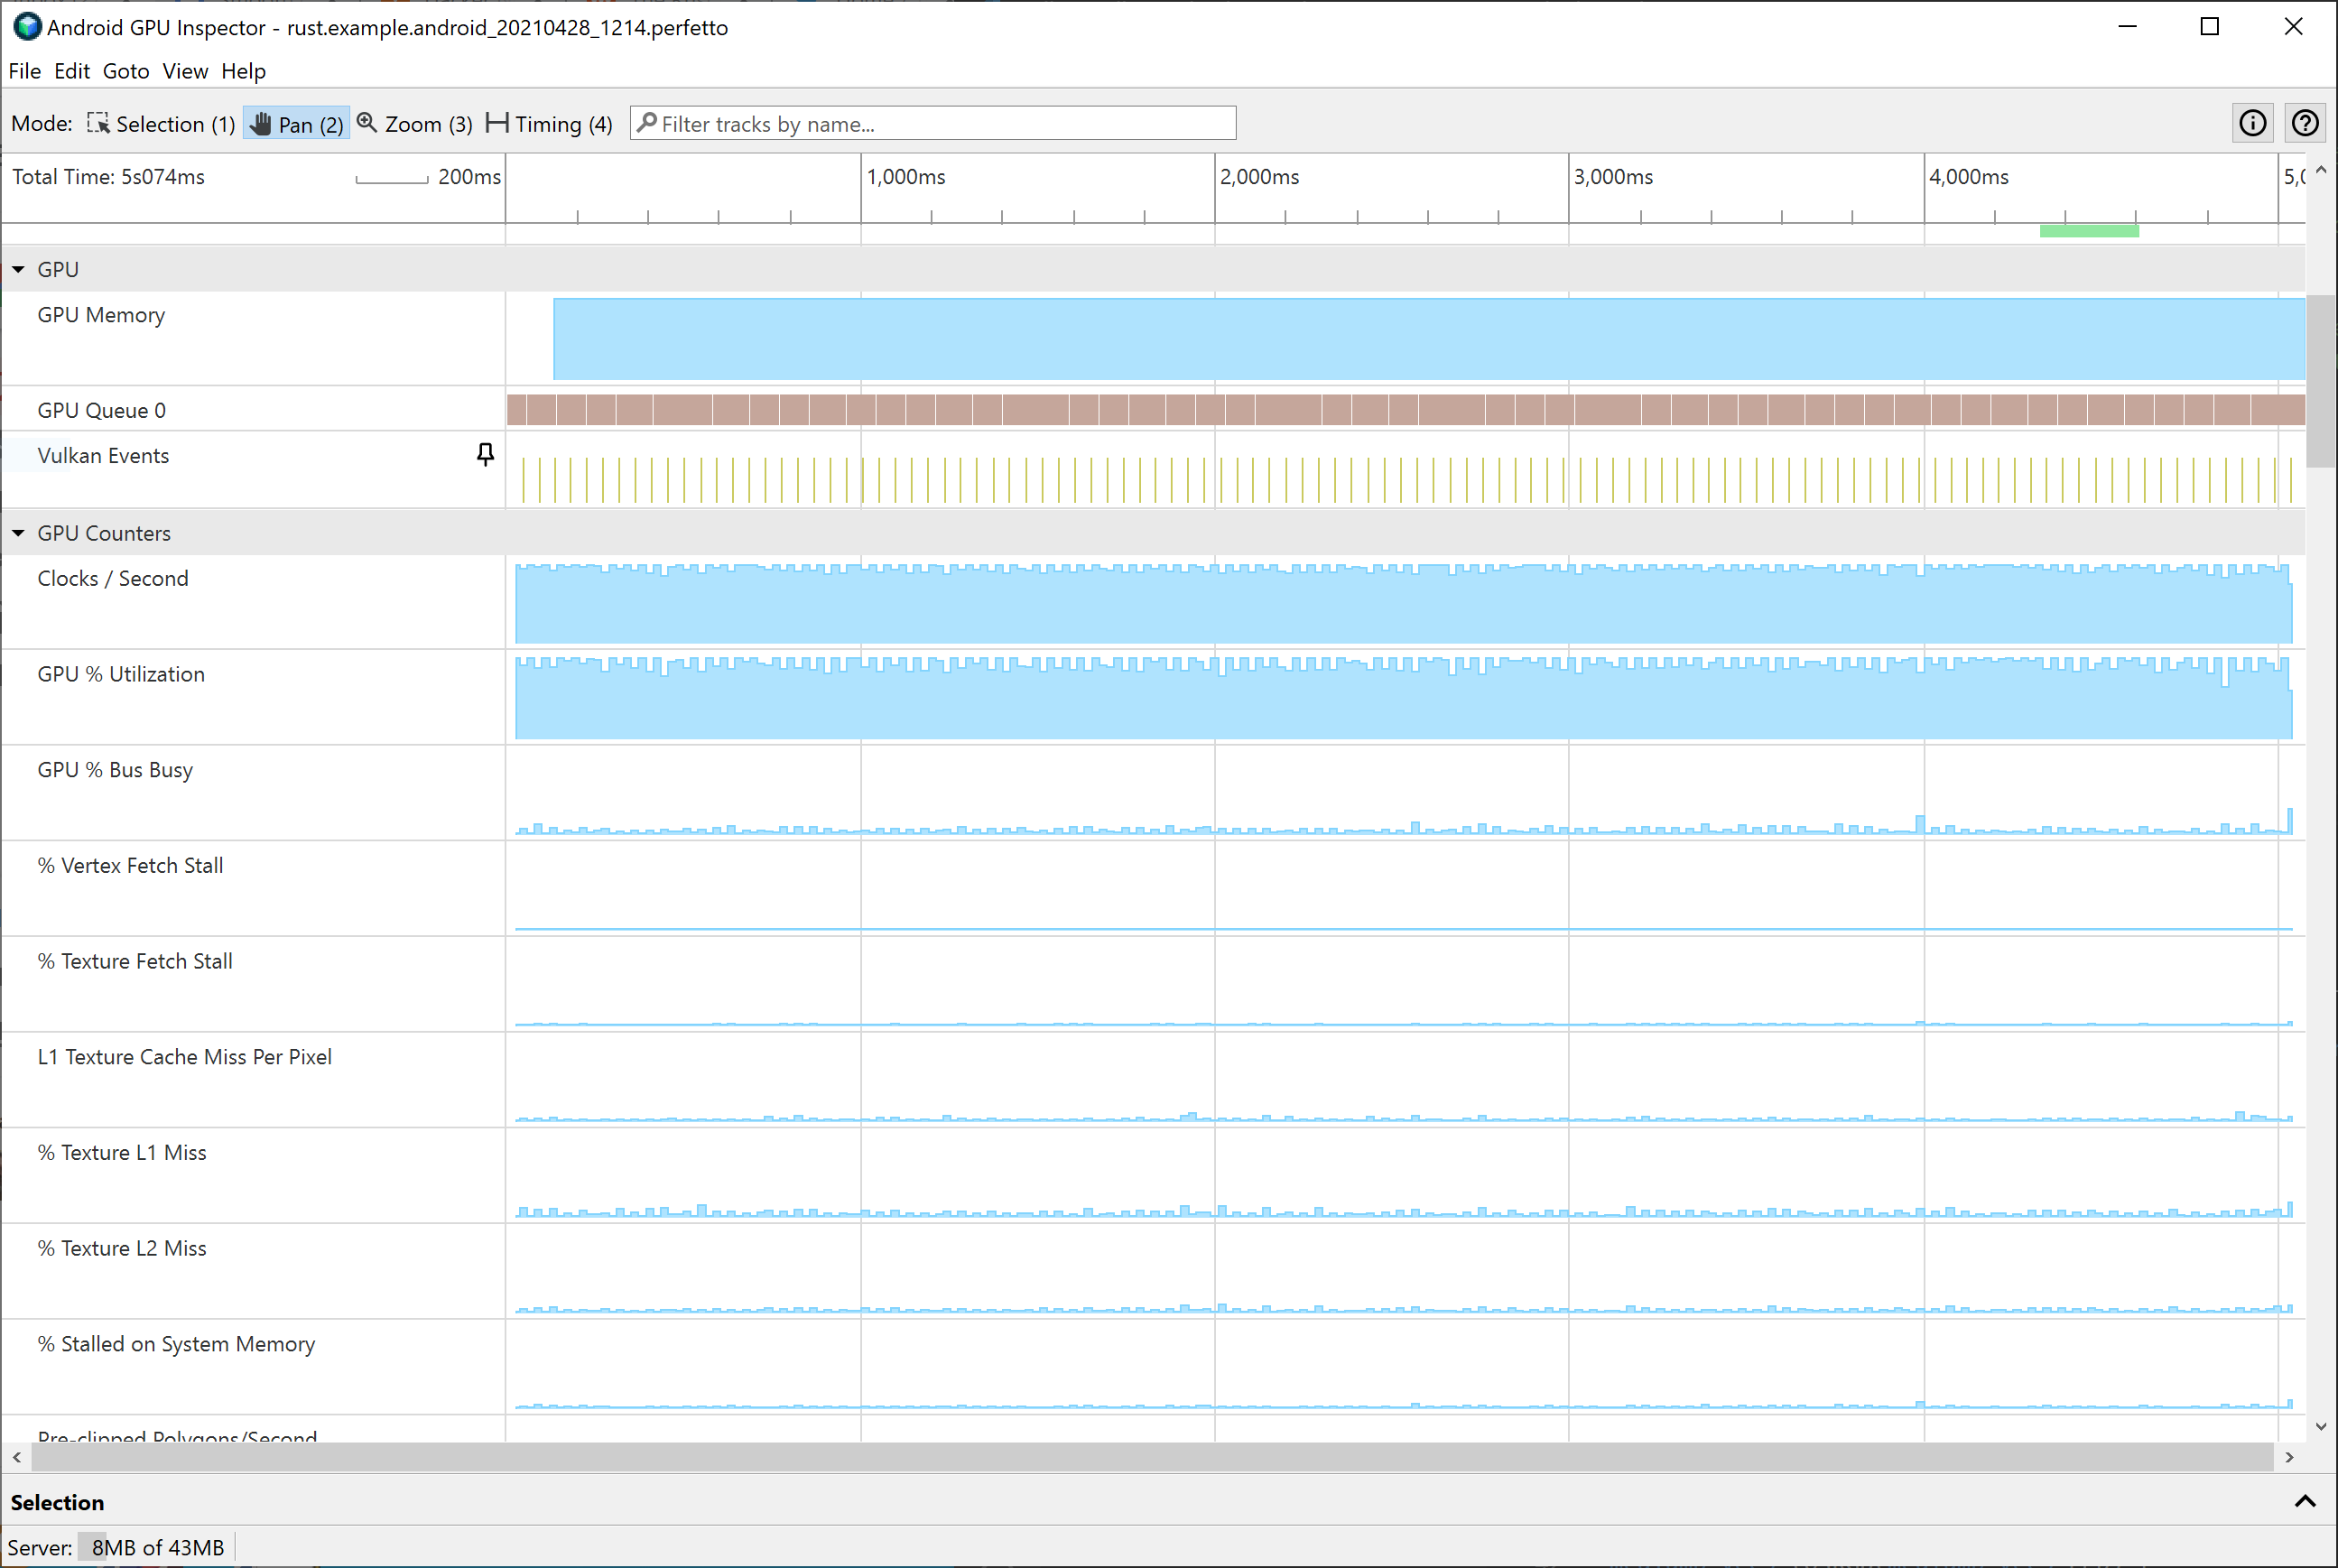
When I did get it running, initially the information didn’t seem very useful. The one thing that stood out was very low ALU utilization, which wasn’t a surprise considering the other things I was seeing.
To me, performance counters are a fairly rough indicator. But I was also able to do some black box testing and instrumentation, and that helped rule out several hypotheses. One knob I could easily adjust is what’s called CHUNK in the shader source. One of the optimizations available to a compute shader (but not a fragment shader) is that each thread can render and write multiple pixels, which especially has the effect of amortizing the memory traffic cost of reading the input scene description. On the flip side, increasing CHUNK also makes the shader more register-hungry, as each thread has to maintain the RGBA color value and other state (area coverage buffer) per-pixel.
AGI has no direct way to indicate the number of workgroups running concurrently, but it was fairly easy to instrument the code to report that, using atomic counters. (Increment a counter at the beginning of the shader, decrement at the end, and accumulate that into a maximum occupancy value).
This testing shows that the number of workgroups is 13, 24, 32, for a CHUNK size of 1, 2, and 4, respectively. Since the number of subgroups is 4/CHUNK, that’s actually saying that the number of subgroups scheduled is quite good even for low values of CHUNK. Additionally, these occupancy numbers are comparable to much simple shaders.
So at this point, we know basically two things. First, we can essentially rule out any effect of “too few registers,” either spilling or low occupancy. Second, by adjusting CHUNK it seems that the memory reads (of the vector path data in particular) are more expensive than they should be. On desktop GPUs, the effect of decreasing CHUNK has some performance impact, but not very much, largely because the reads by different subgroups of the same path data are expected to hit in L1 cache. As we’ll see later, this is a real clue.
By the way, another way in which performance counters are extremely useful is reporting clock frequency. Modern GPUs (not just mobile) have a wide range of clock frequencies, and clock down to save power when the workloads are lighter. A shader taking 10ms when clocked down means something very different than at full clock - the first is a good thing, the second much less so.
Ablation testing
From experimentation, a vague shape was beginning to form. Something about this shader was causing poor performance; simple workloads (even fairly ALU intensive) ran just fine, but the real thing did not. Given that, at this point, the shader compiler and hardware were pretty much a black box, I set to systematically create a series of workloads that explored the space between a simple fast shader and the actual piet-gpu fine rasterizer, to see where the cliff was.
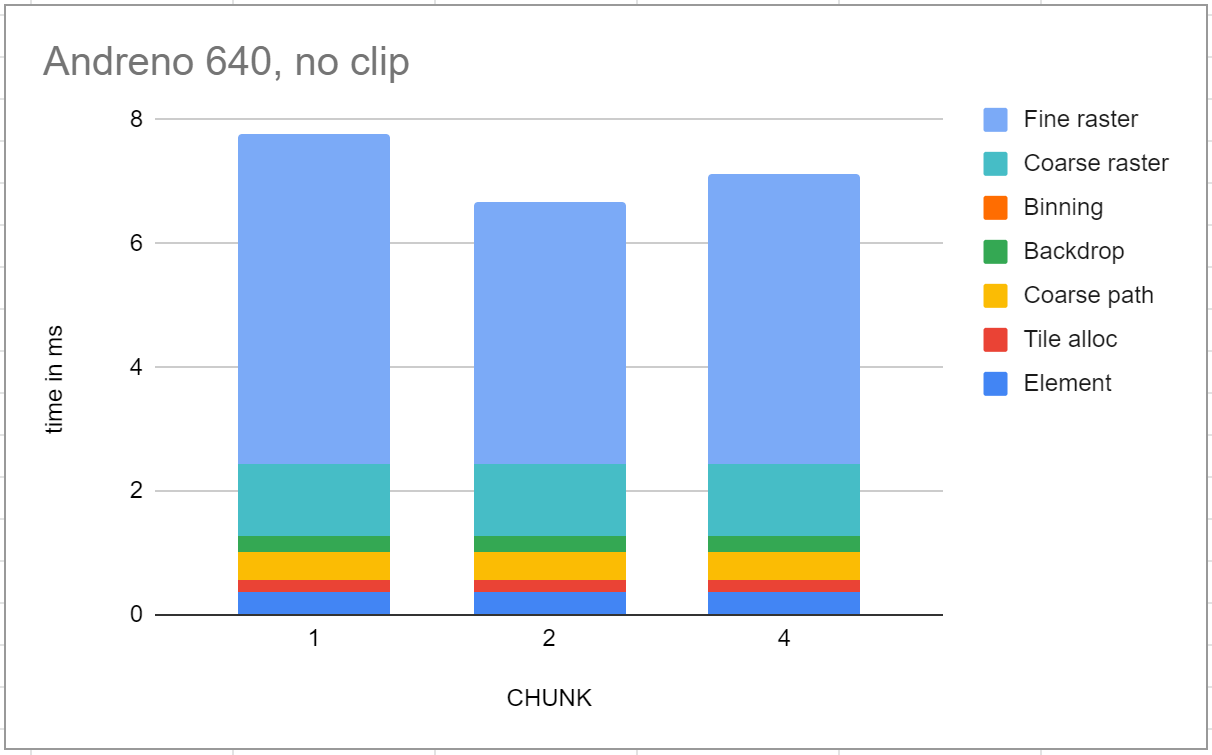
After a fair amount of time exploring dead ends, I found that commenting out the BeginClip and EndClip operations improved performance signficicantly (of course at the expense of making clips not render correctly). This was especially interesting because the tiger workload doesn’t have any clip operations; it was the mere presence of these in the code that was causing the problem.
The performance was much closer to what I was hoping - only about 2x slower than the Intel reference, in line with my expectations for the hardware capability and clock speed. In particular, fine rasterization was 4.22ms at the best CHUNK value, and, like the Intel reference, not hugely sensitive to the setting.
Continuing to bisect, it was specifically the lines in BeginClip that were writing to memory. Further, in what I started to call the “happy path,” overall performance was only weakly affected by CHUNK, pointing strongly to the hypothesis that whatever was happening was making memory reads slow, and in particular caching not effective.
These were strong clues, and narrowed the focus considerably, but still not an explanation of what was really going on, and ultimately not very satisfying, as I wanted clips to work, and I was also worried that as I continued to build out the imaging model, some other enhancement might trigger a similar performance cliff.
I have a blog post planned about clipping in piet-gpu, but it probably helps to explain a little what’s going on. An arbitrary 2D scene is potentially a tree of nested clips. Each clip node in the tree has an associated clip mask. When rendering the clip masks with antialiasing, one way to describe the desired result is to render the children of the clip node into an RGBA buffer, render the clip mask itself into an alpha buffer, and then alpha-composite that (multiplying the two alpha values together) to the render target surface.
The way this works in piet-gpu is that the earlier stages of the pipeline (coarse rasterization) prepare a per-tile command list, which is then interpreted in the last stage (fine rasterization). Commands include BeginClip and EndClip, which push and pop these temporary pixel values onto a stack. Because the nesting depth of clips is not limited, this stack can be of arbitrary depth. We’ve spent some time exploring hybrid approaches where there’s a small window in registers and it spills to memory when that window is exceeded, but at present it always goes to memory.
Reading shader assembly
At this point, I had no desire to remain an ignoramus; I felt that we must know what’s really going on, and determined that we shall know. The next step was to read shader assembly.
For certain GPUs, especially Radeon, this is easy, as the shader compiler is open source and widely available. In fact, the Radeon shader analyzer is available on the Shader playground, a resource analogous to Godbolt for shaders. But for mobile GPUs, it’s a bit harder, as the vendor drivers are proprietary.
Fortunately, for someone as determined as I was, it’s possible, largely thanks to the existence of free tools, especially Freedreno. I was prepared to go as deep as I needed, including getting Freedreno working on some hardware; if it performed well, that would point to the proprietary driver. But if the performance matched, I would easily be able to see the ISA it produced, and dig into that.
As it turned out, I didn’t have to go that far. The glGetProgramBinary function can be used to spit out a binary even from the vendor driver, and then the disassembly tools in Mesa could spit out disassembler for me to read. This way, I could gain more insight into the performance characteristics of the configuration I actually care about, which is vendor drivers. There’s a bit more complexity to this, as the drivers produce both a compressed and an uncompressed format. The corresponding Vulkan call is vkGetPipelineCacheData, but I was only able to get the compressed form. I strongly suspect it’s possible to work out the compression format, but when I got readable results from the GL route, that was good enough for me. (It’s possible that the OpenGL and Vulkan paths would give different binaries, but I don’t have any reason to believe that)
Looking at the disassembly (the full traces are in the piet-gpu bug, and also in a gist), one thing immediately stuck out. In the happy path, all reads from memory use the isam (Image SAMple) instruction, like this:
isam (s32)(x)r0.x, r0.x, s#0, t#1
But in the sad path, the same memory buffer is being read with the ldib (LoaD Image Buffer) instruction instead:
ldib.untyped.1d.u32.1.imm r0.y, r0.y, 1
Checking in with Rob Clark, the author of Freedreno, who now works at Google also, yielded more insight. The isam instruction goes through the texture cache (TPL1), while the ldib instruction bypasses that and goes straight to memory.
The last piece of the mystery was why the compiler was doing that. Again Rob provided the needed insight. Because the shader is reading and writing to the same memory, it is being conservative about cache coherency; it wants to avoid situations where the shader writes to memory, then another thread reads from memory and gets stale data. Bypassing the cache avoids that risk.
In this case, the actual memory locations for reading path data and for storing the clip stack are disjoint, so there’s no such risk. We use the same buffer partly for convenience and partly so there’s one free space pool; if there were multiple buffers, then one buffer might run out of memory while there’s plenty of free space in another, which would be unfortunate.
Given this knowledge, a fix is fairly straightforward, and we also know how to avoid this particular problem in the future. Most likely, we’ll just use scratch memory for the clip stack, rather than sharing a buffer with the scene and path, so all access to that buffer is readonly. There are plenty of other solutions that would work, including a dedicated buffer for the clip stack.
Why we need the Vulkan memory model
In the middle of the investigation, I viewed the proprietary shader compiler with extreme suspicion: it’s making my code run slow, for no good reason that I could see, and also not matching the performance expectations set by other (desktop) GPUs. But now I understand much better why it’s doing that.
Even so, in the longer term I think it’s possible to do much better, and I believe the key to that is the Vulkan memory model. (I’ve written about this before in my prefix sum blog post, but at that time I did not observe a substantial performance difference and this time I do.)
As in the CPU case, the memory model is an abstraction over certain hardware and compiler mechanisms that can either uphold or break assumptions about memory coherence. And in both cases, it’s all about the program explicitly indicating what guarantees it needs, so the shader compiler and hardware are free to apply whatever optimizations they like, as long as the semantics are respected.
On an Intel CPU, respecting the memory model is fairly simple; its total store order takes care of most of it, but in certain cases (sequential consistency semantics), the compiler needs to emit a lock prefix. It also needs to avoid reordering memory accesses around atomic operations in certain cases. A major motivation for the memory model is that ARM (and most other chips) are a bit more demanding; for acquire and release semantics, the compiler needs to emit barrier instructions or special load-acquire and store-release versions of vanilla load and store instructions. The memory model lets you write your code once, then it is compiled to efficient and reliable assembly code as needed by the target architecture. In particular, when only relaxed semantics are needed, generally there is no additional cost.
On a GPU, much more can go wrong, but the principles are the same. There are generally more levels of explicit caching, and more opportunities for parallelism, but at the end of the day, the compiler will convert explicit atomic operations with memory order semantics into code that respects that semantics. Depending on the details, it may emit barrier instructions, select load/store instructions that bypass cache (as would be the case here), or other similar mechanisms. Note that the pipeline barriers familiar to all Vulkan programmers are similar, but different in granularity - those generally cause a cache flush and barrier between shader dispatches, while the memory model is about enforcing semantics within a shader, but possibly between different workgroups, different subgroups, or even different threads (invocations) within a subgroup.
In this particular case, the shader needs only the most relaxed possible memory semantics; each memory write is consumed only by a read on the same thread, which means no special semantics are necessary. Without taking the Vulkan memory model into account, the compiler has no way to know that. The proprietary compiler does report that it respects the Vulkan memory model, but it’s not lying; if it always generates conservative code and then ticks the “support” bit, it’s satisfying the requirements. What is fair to say is that it’s missing an opportunity to optimize. Even so, I understand why they haven’t prioritized it. When I researched my prefix sum blog post, I didn’t find any evidence people were actually writing shaders that used the Vulkan memory model, and I haven’t heard of any since.
In the above, I’m assuming that relaxed read/writes are as efficient as a memory traffic pattern consisting only of reads. I believe that’s true on the Adreno hardware, but might not be universally true. The safest bet is to segregate buffers so that if you have read-only traffic from one of them, it’s in a separate buffer from others you may be writing to.
I should also note that these differences in the way compilers handle memory coherence are not in any way specific to mobile vs desktop; it would not have been surprising to see this issue pop up on desktop GPU with very aggressive caching but not on a simpler mobile architecture. As an example of aggressive caching, RDNA has some cache attached to a SIMD execution unit, which is not necessarily coherent with caches of other SIMD execution units even in the same workgroup.
Overall, I’ve found the Adreno 640 to be generally similar to low-end desktop GPUs, at least in terms of the number of registers available per thread, scheduling of subgroups within a processing cluster, etc. There are fewer processing clusters, a slower clock speed, and less memory bandwidth overall, but those should scale fairly smoothly with existing code and are entirely to be expected. There’s more detail about the A6xx Streaming Processor at the Freedreno wiki, and my empirical observations are consistent.
Conclusion and thanks
Developing GPU compute shaders risks mysterious performance slowdowns when deploying across a range of hardware. With some determination and tools, it’s possible to diagnose those. Fortunately, there’s a lot of activity on better open source tools, much of which is being done at Google, but of course the broader open source graphics community deserves credit too.
One such slowdown is overly conservative memory coherency. In the future, the Vulkan memory model promises to make these performance concerns more explicit and predictable - a slowdown when you’re explicitly asking for barriers or coherent semantics would not be surprising. In the meantime, it’s something to be aware of and test. In particular, just because performance is good on one set of GPUs and drivers is not a guarantee it won’t be a problem on others.
Thanks to Rob Clark for much valuable insight about Adreno ISA, Lei Zhang for pointing me to many useful Adreno (and mobile GPU resources), Hugues Evrard for help with AGI, and Elias Naur for going on this journey with me, as well as tool support in the form of making glGetProgramBinary easy to run.